A version of this article for a wider audience appeared earlier on Frankwatching (in Dutch). This one is written for development teams.
My team counted as one of the most productive. The evidence was our token usage: how much AI we used, compared with other teams.
I am the lead developer of that team, and we use AI on code that runs in production. We do ship a lot, as it happens. The tokens prove none of it. The same number could just as easily have been high for a team that finished very little.
So the question every team using AI runs into sooner or later: if spend does not show what AI delivers, what does?
Why spend became the target
It is the easiest number there is. Every AI tool reports it, it fits in one chart, and it goes up the moment a team adopts the tool. For a manager who has to show an investment is paying off, that is tempting.
This spring a few large companies went all the way: at Meta an employee built a dashboard that ranked colleagues by token usage, and it went offline in April. In May Amazon deleted its leaderboard, over cost, and Uber had used up its 2026 budget for AI coding tools in four months. In August Microsoft told its engineers in an internal memo that tokenmaxxing is not what it steers on, and Uber's CTO said the era of tokenmaxxing is ending. In the LeadDev AI Impact Report 2026, only 19% of respondents rate tokenmaxxing as effective.
The mechanism is old. Reward people on a number and they improve the number instead of the work. With AI spend it is easy to see: the number rises whether anything useful happens or not, and the cheapest way to push it up is to ask more often than you need to. Every point on that leaderboard is also a line on an invoice.
A useful measure is one that does not improve when you only ask more.
More effort, the same result
Leaderboards measure people. I wanted to know whether a single task gets better when the model is allowed to spend more.
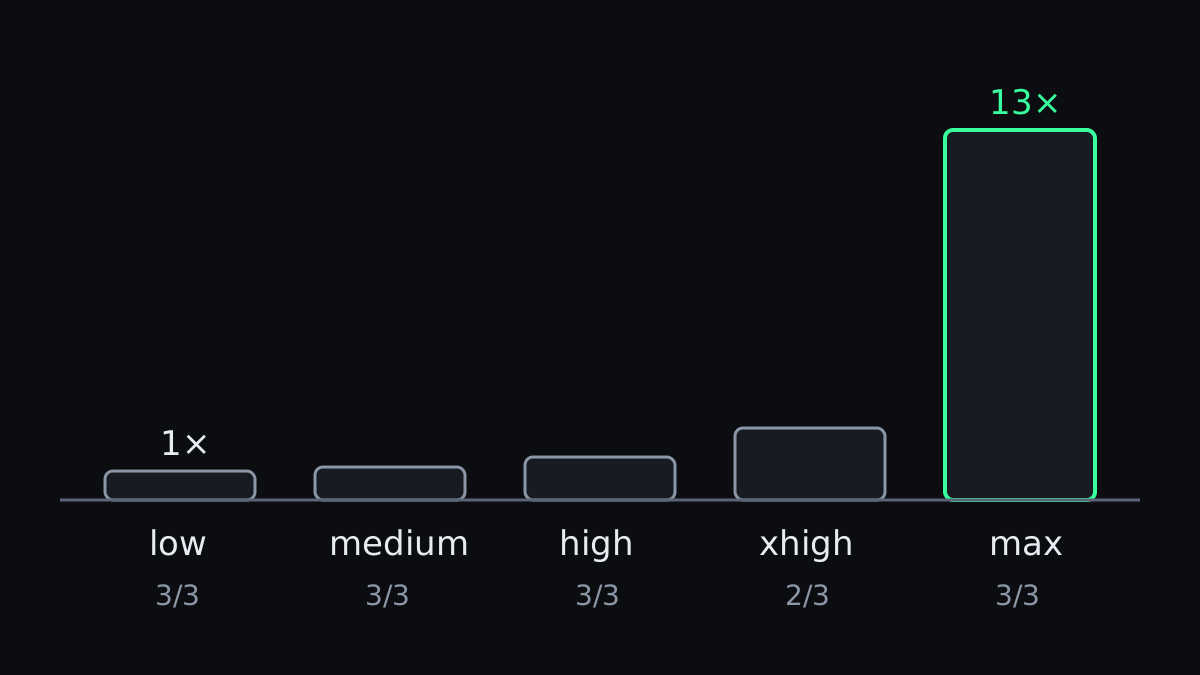
Claude Code lets you set how hard the model works, in five effort levels from low to max. I gave it one small bug-fix task, three times on every level: a 45-line cache with several bugs, where the issue described only one. Afterwards I graded each result with 13 tests the model never saw.
Fourteen of the fifteen runs passed all 13, including all three on low. The one exception fixed what the issue asked for and offered to fix the rest. max cost 13 times as much as low and took 20 times as long. It wins a token leaderboard by a distance and pays thirteen times as much per finished fix for the same result.
That is one small task with one model, and it says nothing about large or vague work. It only shows that spend and results can move independently. The full setup and numbers are in the original measurement, and a larger April study of eight models on hundreds of tasks points the same way: more tokens did not mean more correct answers.
The cost moves to review
AI does produce more. A study at Microsoft from July found developers who started working with agents shipped about a quarter more changes. At a company that set out to double its output, a second study found it got there, though only in the tenth month, and the load per reviewer roughly doubled along the way.
The cost shifts to review, and review appears on no leaderboard.
I notice it every day. I now review three to five times as much code as I used to, and plenty of changes need a few rounds before they are right. More gets made, and a good part of it crosses the table twice.
Three measures that asking more cannot improve
- Cost per merged change. What a change that reached main costs: tool spend plus the hours of whoever wrote, prompted and reviewed it. If AI spend climbs while the number of merged changes stays flat, you are paying for activity.
- Review time per pull request. How long a change waits for review and how long the review takes. When that keeps growing as more AI work comes in, the bottleneck has moved to people, and more AI makes it worse. That is the review bottleneck in one number.
- Rework within two weeks. How much of what was merged gets rewritten, reverted or patched shortly after. Work that comes back does not count as delivered. Git already has this one: it is code churn.
These three can be gamed too, for instance by merging work before it is finished. You cannot make them look better by sending a model more prompts, and that is what makes them more useful than a spend figure.
Where to start tomorrow
When someone asks you for numbers on AI usage in your team, pick one kind of change your team ships every week. Track for a month what it costs, how long review takes and how often it comes back. It is less spectacular than a leaderboard, and it shows whether the investment pays.
And ask the person who reviews everything first. They see it long before a dashboard does.