Two numbers about the same ecosystem, both from this year.
A study published in July found that existing MCP security scanners report 96.89% of servers as risky. I run a scanner over the same ecosystem, and it grades 63% of servers at its lowest risk band.
Both of those are honest. Neither is a lie about the data. The gap between them is the whole subject of this post, because what the two scanners disagree about is what a scanner is entitled to claim.
What the scanner study actually found
The paper is Rethinking MCP Security: A Large-Scale Study of Runtime MCP Servers and Security Scanner Reliability, submitted 13 July 2026. The authors built MCPZoo, 64,611 unique servers with more than 37,288 of them running well enough for dynamic analysis, then pointed the existing scanners at it.
Their finding, in their own words:
While existing scanners report that 96.89% of servers are risky, we find that these signals are unreliable. In particular, manual validation shows that less than 50% of sampled alerts are true positives, and scanner outputs exhibit clear inconsistency across scanners.
Fewer than half the alerts survive a human looking at them. And the scanners do not agree with each other, which means at most one of them can be right about any server they disagree on.
Scanners are still worth running. The problem is the one that hands you a grade and stops there, because you cannot tell which half of its output you are holding.
The other ecosystem-scale measurement, A First Look at the Security Issues in the Model Context Protocol Ecosystem (revised April 2026, 67,057 servers across six public registries), lands on the entry point rather than the scanner: "At the registry-level, weak vetting and ownership checks allow adversarial or hijacked servers to enter hosts." Their own tool flagged 833 vulnerable servers and 18 with suspicious descriptions out of those 67,057.
Two studies, two very different alert counts, same ecosystem. That is the pattern.
Three things a signal can be
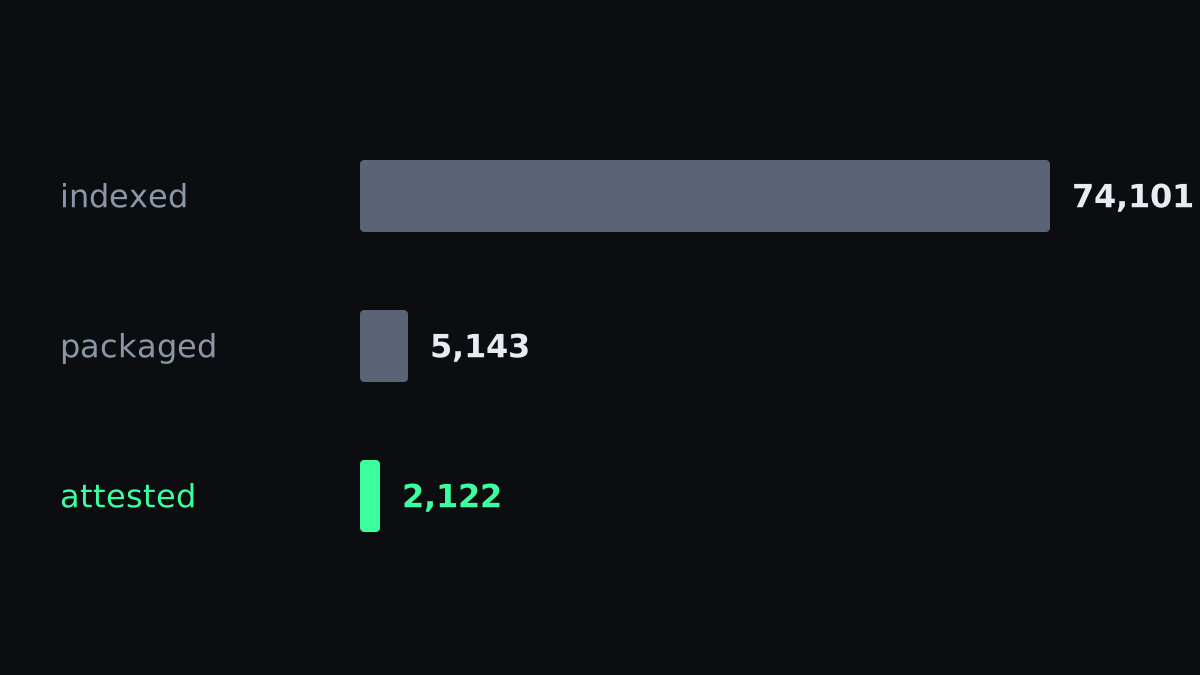
I built MCP Observatory partly to have somewhere to put this problem. At 09:31 UTC on 6 September 2026, the moment the snapshot behind every figure in this post was taken, it held 74,101 servers and had read the source of 66,212 of them. Treat those two numbers as a photograph. The section below says how fast the subject is moving. Every signal it shows carries a tag for what backs it, and there are exactly three:
- attested. Backed by a verifiable record: a CVE or OSV entry, a cryptographic build attestation, or the published artifact itself.
- reported. Asserted by a third party, a registry or a directory, and relayed. True that they said so, not independently confirmed.
- inferred. A heuristic. A keyword match, a pattern, a score. A "review this" prompt, never a verdict.
Sorting the corpus into those three buckets is bleaker than it sounds.
Attested is rare. A build attestation needs a packaging step to attach to, and only 5,143 of the 74,101 servers publish to npm or PyPI at all. Of those, 2,122 carry one. The remaining 68,958 are repositories you clone and run, with nothing cryptographic to check.
Reported is most of what looks like verification. 18,946 servers carry an official-registry signal and 51 carry a directory listing. That is a registry saying the server is what it claims to be. Worth having, and a long way from anyone having checked.
Everything else is inferred, and inferred is where the volume is. 45,525 safety findings across 17,852 servers. 26,821 of them come from a generic static-analysis pass rather than anything MCP-specific, and 24,373 of those are a single lowest-severity code pattern.
The permission flags tell the same story from the other side. Across the 33,222 servers whose tools have been captured, 496,883 tools in total, the detector raises no permission flag at all on 27,352 of them. Eighty-two percent of servers light up nothing. Read that as a keyword matcher finding no keywords, which is some distance from 82% of servers being safe.
The state nobody displays
Here is the part I think the whole category gets wrong, and it took building the thing to see it.
A scanner has three possible answers about a server. It can have looked and found something. It can have looked and found nothing. And it can have never looked.
The second and third are indistinguishable in every dashboard I have seen. Both render green.
So the observatory refuses to show a reassuring grade over source it never read. If the source was never analysed and the grade came out at A or B, the label is "insufficient evidence" instead, because "we found nothing" and "we never looked" produce the same colour and mean opposite things. Right now that applies to 1,944 servers. Small against 74,101, and every one of them would read as clean anywhere else.
The inverse case gets its own label. 101 servers carry a concerning grade with unread source, and there the grade is real but it is a floor: reading the code could only push it up.
The ground moves while you read
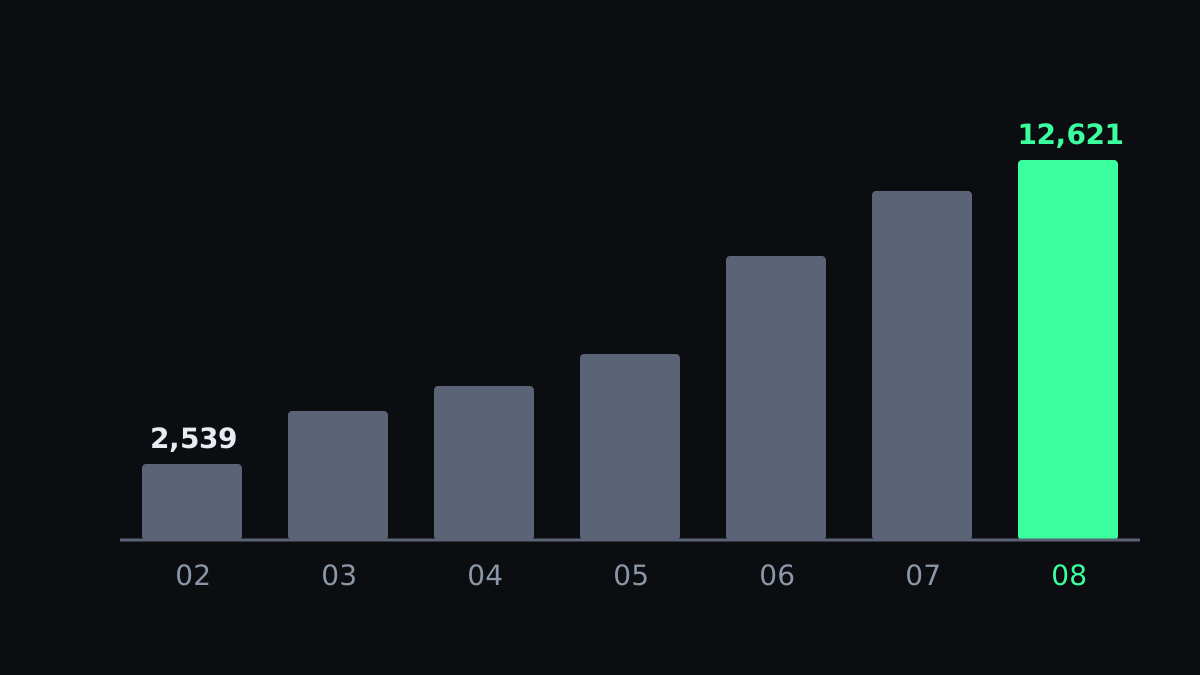
Every figure above is a photograph. Here is the shutter speed.
Over the thirty days to 6 September, the servers in this corpus shipped an average of 3,657 releases a day, with daily counts running between 2,913 and 4,519. In the same window, 418 new repositories carrying an MCP server were created per day.
That second number is accelerating. New repositories per month: 2,539 in February, 5,120 in April, 9,441 in June, 12,621 in August.
Two caveats, and they push the same way. A creation date is known for 63,581 of the 74,101 servers, so these are lower bounds. And the newest repositories are exactly the ones a crawler is least likely to have found yet, so the recent months are understated rather than inflated. The growth is at least this steep.
Which is the real reason I date every number I publish. 74,101 was true at 09:31 UTC on 6 September 2026, and it was wrong by lunchtime. A count in this field has a half-life measured in hours, and that belongs next to the count rather than in a footnote under it.
It also sets up the next problem. An ecosystem shipping 3,657 releases a day is an ecosystem that outruns whoever is scanning it.
A grade has a shelf life
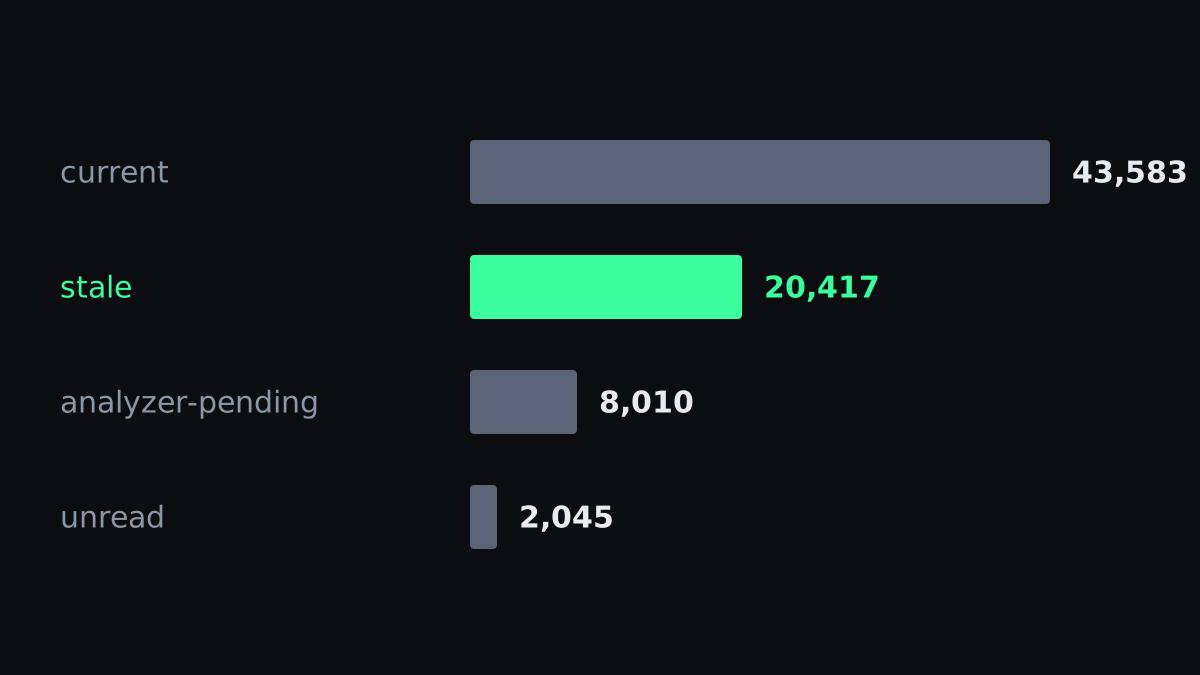
The scan happened on a particular day, against a particular commit. The server kept moving.
Of the servers currently carrying a grade, 20,417 are stale in the strict sense: a newer package version shipped, or the repository was pushed to, after the analysis ran. That is 28% of the graded corpus describing code that is no longer the code you would install.
Nobody's dashboard says this out loud, mine included until recently. A grade with no date on it is a claim about a snapshot presented as a claim about a server.
The instrument moves too
This one caught me out, and it is the reason I no longer trust any drift number at face value.
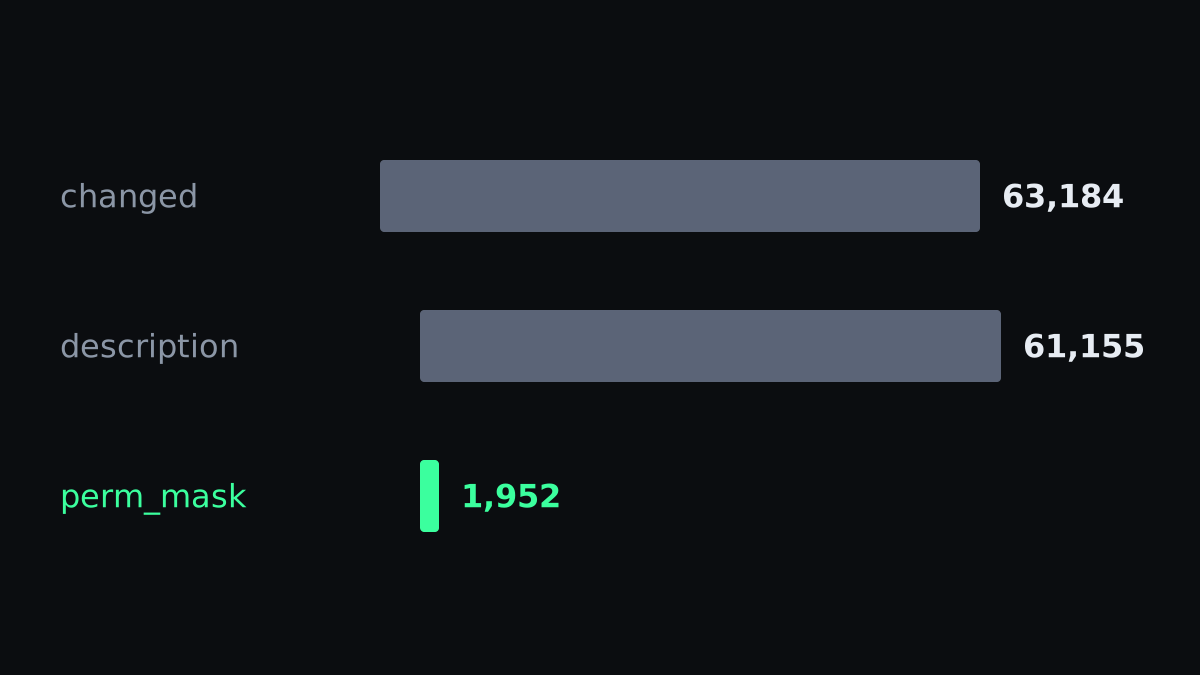
The observatory keeps a history of every tool definition it has seen: name, description, input schema, and an inferred permission mask. Across 525,435 distinct tools, 63,184 have more than one recorded definition. My first instinct was to read that as the ecosystem changing under its users.
Then I checked which part changed. 1,952 of those tools had their permission mask move while the description and the input schema stayed byte-identical.
Nothing about those servers changed. The classifier changed. I had improved the permission detector, and a set of tools that ships only minified code stopped matching keywords it used to match. The measurement moved and the world did not.
That is the same trap as reading a duplication score on AI-written code and concluding the code got cleaner, when what actually moved was the detector. An inferred signal is a function of two things, and only one of them is the server.
What a changed description is worth
The genuinely interesting number in that history is the descriptions.
Of the 63,184 tools with more than one definition, 61,155 changed their description. Only 280 changed their input schema. 60,952 changed the text while the machine-readable contract stayed exactly the same.
The description is the part the model reads and acts on. The schema is the part your code validates against. Sixty thousand tools rewrote the instruction to the agent without touching the interface to the program.
That is the exact shape of a tool-poisoning rug pull, where a server ships clean, gets installed, and then edits what its tool tells the model to do. It is also the exact shape of somebody fixing a typo in their docs.
I cannot tell those apart from the outside, and neither can anyone else. The dedicated rug-pull rule fires 81 findings across 51 servers, and I would not defend that number as complete. So the description-change signal ships as what it is: a list of servers worth re-reading before you trust them again, tagged inferred, with no accusation attached. Moving a version out from under an installed dependency is a known move in this ecosystem, and the tool description is a softer target than the version number.
What to actually read before you install
The vetting checklist still holds and this does not replace it. What the data adds is an ordering, by how much the signal is worth:
- Is there an attestation? Rare, binary, and the only thing on this list that is cryptographic. Most servers cannot have one, which is itself worth knowing.
- Was the source actually read, and when? A grade over unread or six-month-old source is a different object from a grade over the commit you are about to install.
- Has the tool description changed since it was listed? Not damning on its own. Worth ten seconds of your reading time, because it is the field that steers the model.
- What does the permission surface claim? 658 servers have one tool that reaches the network and another that touches credentials, which is the pair an injected instruction chains. Treat a quiet result as "the matcher found nothing", not as a clean bill.
- Who says it is fine, and are they the same party who published it? Most verification in this ecosystem is a registry relaying the publisher's own claim.
Five questions, and each one has its own answer for how much you should believe it.
The thing I keep coming back to is that the MCP supply chain inherited npm's distribution model without inheriting even npm's modest provenance story. What it did inherit is the appetite for a single letter grade that makes the decision for you.
Every grade and permission flag on the observatory is an inferred review prompt rather than a verdict, and each one is tagged by what backs it: attested, reported, or inferred. That is a worse product. Nobody wants five hedged answers when a competitor offers one confident letter.
It is the only version I can defend when fewer than half the alerts in this field survive somebody checking them.